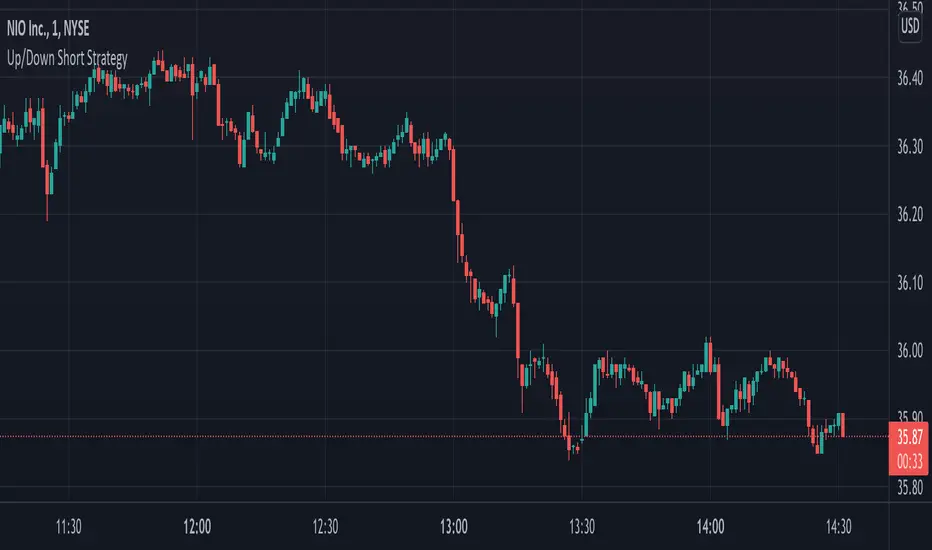
Up/Down Short StrategyThis is a consecutive bar up/down strategy for going short only where you can specify how many bars down to enter and how many bars up to exit. It also has code to check and make sure the condition is still true when launching the official alert, which helps back testing and live results line up, however be sure to enter commission and slippage into the properties to accurately reflect profits. I added back testing date ranges to this so you can easily pull up and see back tested results for a certain date range. I also added a buy and sell messages, close messages and take profit/stop loss message fields in the properties so you can launch alerts that will work with automated trading services. Simply enter your messages into those fields in the properties and then when you create an alert enter {{strategy.order.alert_message}} into the alert body and it will dynamically pull in your buy and sell messages when it fires alerts. I also added time restriction so you can enter trades only during the time frame specified. You can change it to any time frame, such at 0930-1600. Set the time restriction field to empty by default since otherwise the strategy won't take all trades like normal. So to enable time restriction enter a time frame in the format 0000-0000. I also added the ability to check off a box that will close the open trade at the end of the time restriction. So if you set the time frame to 0930-1600 and check off to enable close trade at end of time frame then it will look to exit the trade at the close of the next bar.
Search in scripts for "Automated Trading"
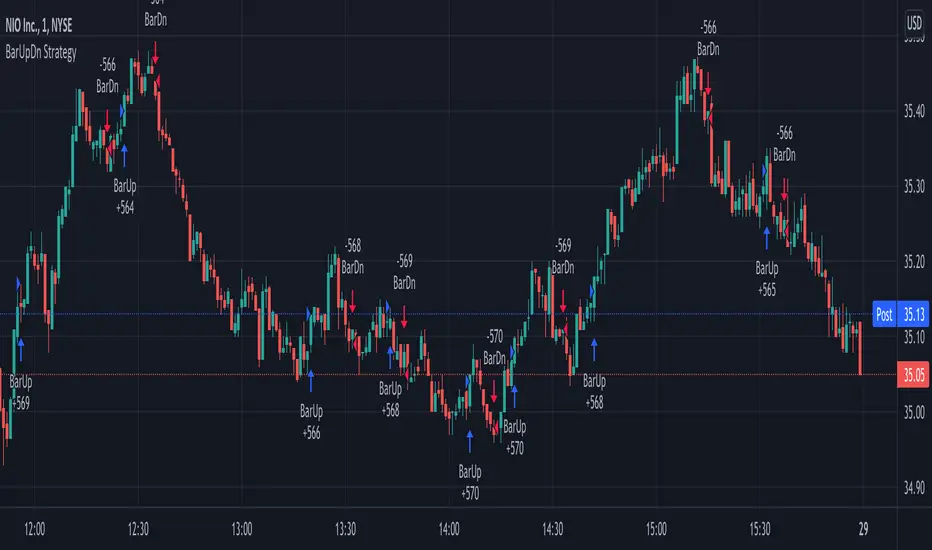
BarUpDn Long StrategyThis is a bar up/down strategy for going long only where you can specify how many bars up to buy and how many bars down to sell. It also has code to check and make sure the condition is still true when launching the official alert, which helps back testing and live results line up, however be sure to enter commission and slippage into the properties to accurately reflect profits. I added back testing date ranges to this so you can easily pull up and see back tested results for a certain date range. I also added a buy and sell message fields in the properties so you can launch alerts that will work with automated trading services. Simply enter your buy message and sell message into those fields in the properties and then when you create an alert enter {{strategy.order.alert_message}} into the alert body and it will dynamically pull in your buy and sell messages when it fires alerts.

BarUpDn StrategyThis is a bar up/down strategy where you can specify how many bars up to buy and how many bars down to sell. It also has code to check and make sure the condition is still true when launching the official alert, which helps back testing and live results line up, however be sure to enter commission and slippage into the properties to accurately reflect profits. I added back testing date ranges to this so you can easily pull up and see back tested results for a certain date range. I also added a buy and sell message fields in the properties so you can launch alerts that will work with automated trading services. Simply enter your buy message and sell message into those fields in the properties and then when you create an alert enter {{strategy.order.alert_message}} into the alert body and it will dynamically pull in your buy and sell messages when it fires alerts.
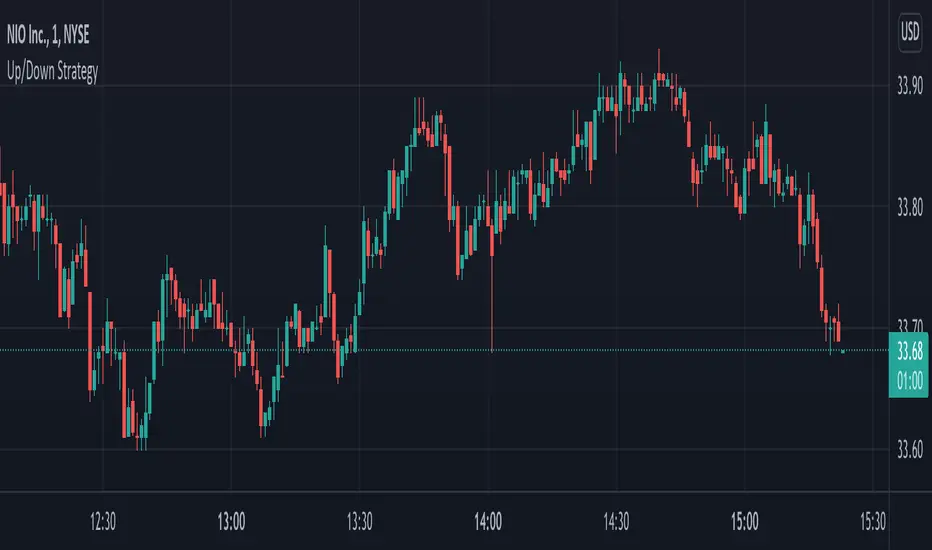
Up/Down Long StrategyThis is a consecutive bar up/down strategy for going long only where you can specify how many bars up to buy and how many bars down to sell. It also has code to check and make sure the condition is still true when launching the official alert, which helps back testing and live results line up, however be sure to enter commission and slippage into the properties to accurately reflect profits. I added back testing date ranges to this so you can easily pull up and see back tested results for a certain date range. I also added a buy and sell message fields in the properties so you can launch alerts that will work with automated trading services. Simply enter your buy message and sell message into those fields in the properties and then when you create an alert enter {{strategy.order.alert_message}} into the alert body and it will dynamically pull in your buy and sell messages when it fires alerts.

Up/Down StrategyThis is a consecutive bar up/down strategy where you can specify how many bars up to buy and how many bars down to sell. It also has code to check and make sure the condition is still true when launching the official alert, which helps back testing and live results line up, however be sure to enter commission and slippage into the properties to accurately reflect profits. I added back testing date ranges to this so you can easily pull up and see back tested results for a certain date range. I also added a buy and sell message fields in the properties so you can launch alerts that will work with automated trading services. Simply enter your buy message and sell message into those fields in the properties and then when you create an alert enter {{strategy.order.alert_message}} into the alert body and it will dynamically pull in your buy and sell messages when it fires alerts.
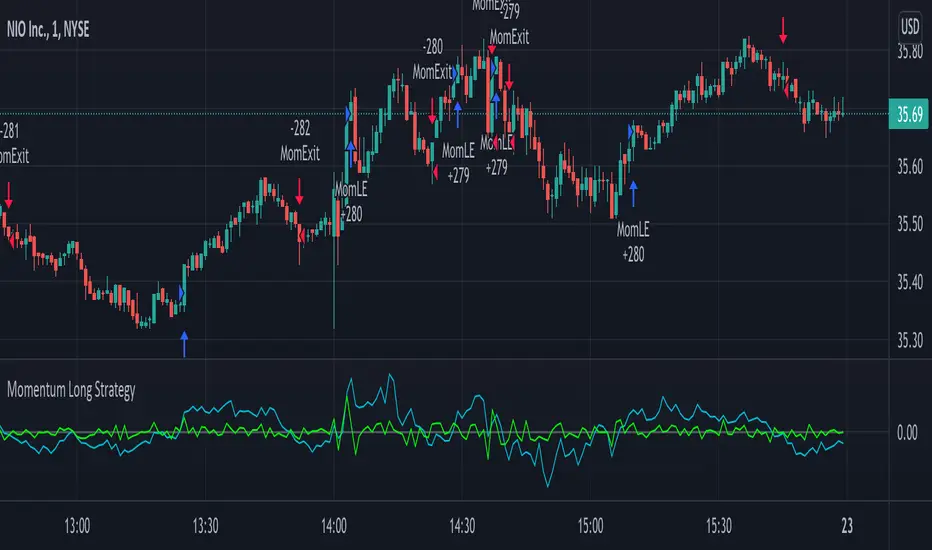
Momentum Long StrategyThis is a momentum indicator strategy that plots 2 lines on the momentum indicator and if both cross above zero a long entry is generated and if both cross below zero a long exit is generated. It also has code to check and make sure the condition is still true when launching the official alert, which helps back testing and live results line up, however be sure to enter commission and slippage into the properties to accurately reflect profits. There's also an optional "percent" option and selecting the MOM1 option in the "MOM Choice" field as it uses a slightly different calculation and may provide better results than the standard momentum calculation. The zero line plotted on the indicator so you can clearly see when lines are crossing above or below zero. Also I'd like to thank @felipecms14 for his open source momentum code. I added back testing date ranges to this so you can easily pull up and see back tested results for a certain date range. I also added a buy and sell message field in the properties so you can launch alerts that will work with automated trading services. Simply enter your buy message and sell message into those fields in the properties and then when you create an alert enter {{strategy.order.alert_message}} into the alert body and it will dynamically pull in your buy and sell messages when it fires alerts.
SMA StrategySMA Strategy for going long or short when a short sma crosses a long sma. This script was published by CaptJava. I added to it the ability to select a back testing date range and choose to go long, short or swap orders. You can enter automated trading buy and sell messages in the properties and then put {{strategy.order.alert_message}} in your webhook alert message and it will dynamically populate your buy or sell message.

ADX + RSI Strat// This is a strategy that uses the 7 Period RSI to buy when the indicator is shown as oversold (OS) and sells when
// the index marks overbought (OB). It also uses the ADX to determine whether the trend is ranging or trending
// and filters out the trending trades. Seems to work better for automated trading when the logic is inversed (buying OB
// and selling the OS) wihout stop loss.

QFL single TF with alertsBacktesting compatible QFL pine script w/alerts
This version of QFL was made based on this one:
From author:
www.tradingview.com
I made the following additions according to my requirements:
- I need to use pine script 4
- I needed to avoid repainting issues so I'm not calling directly security, I'm using the wrapper function.
- There might be still repainting issues when you use "max base age" which uses the function "barssince" so be careful, you can disable it by setting its value to zero.
- Alerts so I can use it for automated trading and bots
- In order to make this signal compatible with the backtest script there's an option provided in the settings. If you enable this option this indicator will plot 1 whenever there's a BUY signal. This will allow the backtest to pick the "QFL Buy" from external indicator so it can perform the backtest.
I recommend some of these settings to start playing with the chart in 15 min / QFL in 1, 2 or 4 hours.
The higher the TF the more conservative.
QFL with 3.5% is pretty popular but you can try higher QFL percentage settings for a more conservative approach.

[NLX-L2] Hurst Exponent Signal Filter- Hurst Exponent Signal Filter -
The Hurst Exponent Signal Filter is meant to be used with an external signal source, this can be any indicator with a signal plot output (-1 Sell / 1 Buy)
It filters out a lot of noisy signals and improves the performance of many indicators.
- Example: How to Use -
1. Add a trend Indicator like Trend Index MTF to your chart
2. Add an indicator with a signal plot like Fishers Stochastic Center of Gravity to your Chart and select the Trend Index MTF with Type L1 in the Settings as Signal Source
3. Add this Hurst Signal Filter to your Chart and select the Fishers Stochastic Center of Gravity with Type L2 in the Settings as Signal Source
4. Add the Backtest Module to your Chart and select the Hurst Signal Filter with Type L2 as Source
- Alerts for Automated Trading -
See my signature below. Contact me for the Alert module.

Signal/Noise Adaptive Moving Average [Jwammo12]This is an adaptive moving average based on a signal noise ratio. It's inspiration is frm Eugene Durenard's book Professional Automated Trading Theory and Practice. Shout out to CryptoStatistical for his implemenation of Durenard's concepts that became the basis for this script.
Check out my breakout strategy based on this concept here .

Shadow Index and Detrended Shadow IndexFrom Eugene Durenard (Advanced Automated Trading) this is an useful indicator to spot price consolidations and reversals.
"For nonlinear trends in time and areas of high probability, how are reversals detected? To gain intuition, first consider the difference, when looking at a bar chart, of a linear trend versus a congestion: One observes that, on the same time interval, there is a divergence between the degree of overlap of bars, as seen projected onto the price axis (as if a light was shining on them from the right). For a trending market, that overlap, or shadow, is lighter than for a congested market. This gives rise to the shadow index."
Has also good capabilities at predicting an increase of volatility.
"Now, when the market is in a linear trend or a congestion, the DS I will be high. On the other hand, it will be low when the market accelerates away from a linear trend. So a pattern of mean-reversion exists for the DS I but the times when it is low are rare, because so are accelerations."
